Solar Payback Calculator
Enter the system cost, size and your electricity price to find the payback time and the savings year by year.
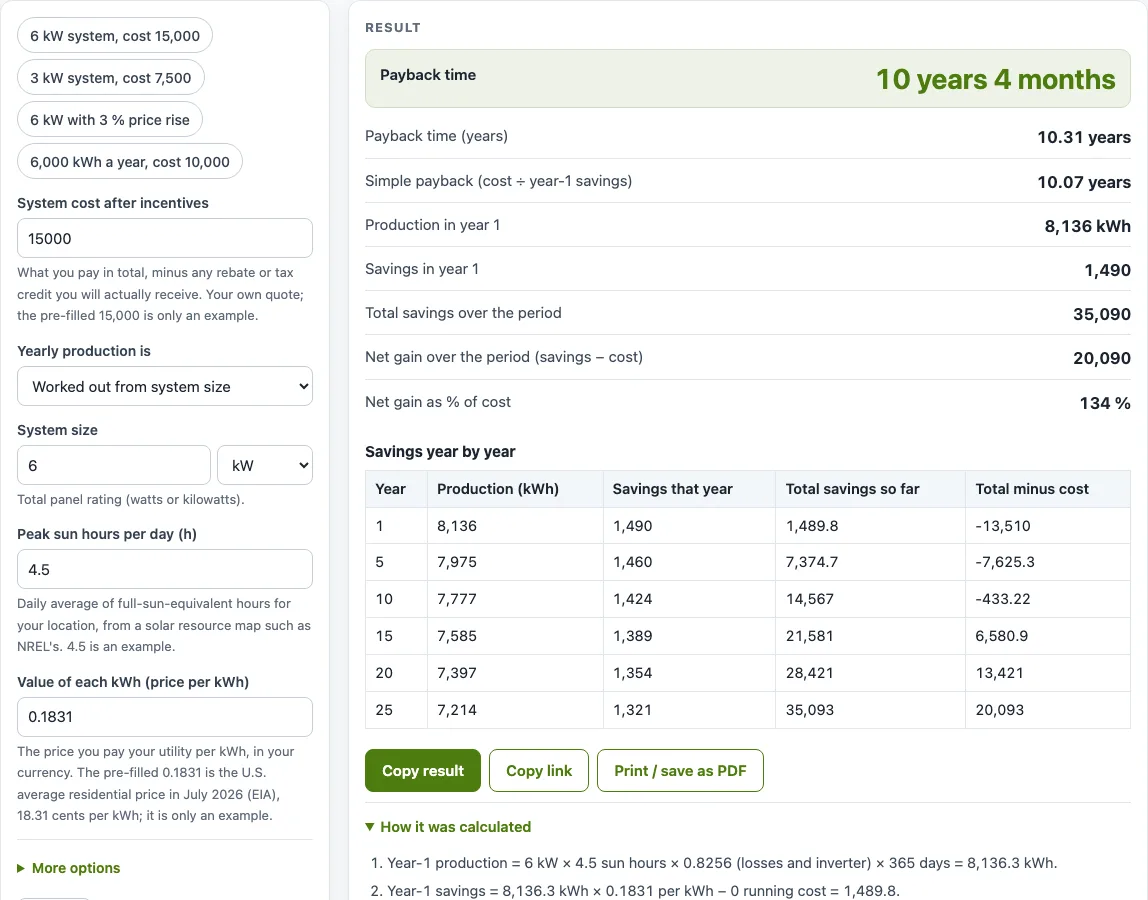
How to use the Solar payback calculator
- Set Yearly production is to Worked out from system size or Entered in kWh per year.
- If you chose Worked out from system size, enter System size in W or kW, then enter Peak sun hours per day (h) for your location. Use a solar resource map such as NREL’s to find this value.
- If you chose Entered in kWh per year, type Production in year 1 (kWh) from your installer’s quote or from a tool such as NREL PVWatts.
- Enter Value of each kWh (price per kWh) using the price on your utility bill, in your currency.
- Enter System cost after incentives: the total you pay, minus any rebate or tax credit you will actually receive.
- Open More options and set Electricity price rise per year (%), Panel output loss per year (%), Running cost per year and Years to look at. In the system-size mode, also check System losses (%) (14 % by default) and Inverter efficiency (%) (96 % by default).
- Read the results: Payback time, Simple payback, Savings in year 1, Total savings over the period, Net gain and Net gain as % of cost. Then check the year-by-year savings table.
The example buttons above the form load ready-made scenarios, and Reset restores the starting example. Copy link stores every input in the page address, so the same calculation opens again later. Copy result gives the result lines with a link. Print / save as PDF includes your inputs, results, steps and the date.
How do you calculate solar payback period?
Simple payback is the system cost divided by the savings in year one. Year-one savings equal your year-one production in kWh multiplied by your price per kWh.
Year-one production is system size × peak sun hours × (1 − system losses) × inverter efficiency × 365. For the 6 kW example, with 4.5 peak sun hours, 14 % system losses and 96 % inverter efficiency, that gives about 8,136 kWh. At 0.1831 per kWh, the first-year savings are about 1,490, so simple payback is about 10 years (15,000 ÷ 1,490).
How long does it take for solar panels to pay for themselves?
For that same 6 kW example, the calculator reports a payback time of 10 years 4 months. The time depends on the system cost, how much the panels produce, your price per kWh and your running costs. A lower cost, a sunnier site or a higher electricity price all shorten it.
Another worked example from the calculator: a cost of 10,000 with 6,000 kWh a year at 0.1831 per kWh and no output loss gives a payback time of 9 years 1 month.
Does the payback include panel degradation?
Yes, the payback time does, because the calculator works year by year and reduces production by the panel output loss each year. The pre-filled loss is 0.5 % a year, the median of field measurements in the NREL review by Jordan and Kurtz (2013). A newer NREL study of U.S. fleet data found a median of 0.75 % a year, so you can enter a different figure, such as your panel warranty value.
Simple payback does not include it, because it uses only year-one savings. That is why the payback time is a little longer than the simple payback when there is output loss and no price rise.
What is the break-even point for solar panels?
The break-even point is the year when cumulative savings from the panels equal the system cost. The calculator reports this as the payback time. Before that year, you have saved less than you spent; after it, the net gain is positive.
Net gain is total savings over the period minus the system cost. If the savings do not reach the cost within the years you set, the result reads “not within N years”. Running costs can also block break-even: if the yearly running cost is as large as the yearly savings, the system never pays back.
Worked examples
| Input | Result |
|---|---|
| cost 15000, 6 kW, 4.5 sun hours, 0.1831 per kWh | payback 10 years 4 months, 8,136 kWh in year 1 |
| cost 10000, 6000 kWh a year, 0.1831 per kWh | payback 9 years 1 month, 6,000 kWh in year 1 |
| cost 18000, 6 kW, 4.5 sun hours, 0.25 per kWh | payback 8 years 1 month, 8,136 kWh in year 1 |
| cost 7500, 3000 W, 5 sun hours, 0.1831 per kWh | payback 9 years 3 months, 4,520 kWh in year 1 |
Calculated by the tool above with these values.
Frequently asked questions
Should I enter the system cost before or after a rebate?
Enter the cost after any rebate or tax credit you will actually receive. The calculator does not know about incentives and does not calculate them, so it uses the figure you type.
What value should I use for peak sun hours?
Use the daily average of full-sun-equivalent hours for your location, from a solar resource map such as NREL’s. The 4.5 hours shown is only an example. The calculator warns you if the value is below 2 or above 8, because those values are unusual.
Is my data sent to a server?
No. The calculator runs entirely in your browser, nothing is uploaded, and no sign-up is needed.
Why is my payback time longer than the simple payback?
Simple payback uses only year-one savings. The year-by-year calculation includes the yearly loss of panel output, which lowers savings over time, so the payback time can be longer. A yearly electricity price rise works the other way and shortens it. A yearly electricity price rise works the other way and shortens it.
Can I use the results in a quote or proposal?
Yes. Results, charts and printouts can be used freely in commercial work such as quotes, proposals, reports and service records, and no attribution is needed.
Related tools
- Solar loan calculator: use it to see the monthly cost if you pay for the system with a loan.
- Solar panel output calculator: use it to estimate how much electricity a panel array produces before you work out savings.
- Solar panel calculator: use it to start from the basics of sizing a solar panel system.
- Electricity cost calculator: use it to work out what your current electricity use costs, to check your price per kWh.
- Solar battery size calculator: use it to size a battery if you plan to store solar power.
- All solar and battery calculators: use it to browse every calculator on this site.
Sources
- Production default: NREL PVWatts Version 5 Manual (Dobos 2014, NREL/TP-6A20-62641) — default system losses 14 % and inverter efficiency 96 %, summarised by Aurora Solar
- Panel output loss: Jordan and Kurtz, Photovoltaic Degradation Rates — an Analytical Review, Progress in Photovoltaics 21 (2013), NREL: median of about 0.5 % a year; NREL, Long-term degradation of 8 GW of U.S. solar (pv magazine report of the 2024 NREL study): median 0.75 % a year
- EIA, Electric Power Monthly, Table 5.6.A: U.S. average residential price 18.31 cents per kWh in July 2026 (example price)